 One Community
Solar Energy Microgrid Setup and Maintenance
This page is part of the Highest Good energy component of One Community and an open source guide to setting up a solar micro grid (with wind power and possibly micro-hydro also) for the Duplicable City Center® and Earthbag Village. It is purposed to help people understand the how’s and why’s of design and setup for replication and better understanding and implementation.
We discuss this with the following sections:
- What is a Solar Energy Microgrid
- Why Open Source Solar Microgrid Design and Setup
- Ways to Contribute to this Open Source Component
- Key Consultants to this Component of One Community
- Related Pages
- Solar Energy Design & Implementation Details
- Why Solar
- Where to Set Up a Solar Microgrid
- Determining How Much Power to Produce
- System Design and Equipment
- Placement/Distance Considerations
- Solar Sizing
- Choosing the Best Solar Hardware
- Calculations – Duplicable City Center
- Calculations – Earthbag Village
- Calculations – Intertie of City Center and Earthbag Village
- Penetration of the Microgrid
- Maintenance and Control
- Initial Cost Analysis
- Cost of Installed System
- Sample Cost Summary
- Future Considerations
- Resources
- Summary
- FAQ
NOTE: THIS PAGE IS NOT CONSIDERED BY US TO BE A COMPLETE AND USABLE TUTORIAL UNTIL
THAT BUILD TO THIS PAGE ” IN THE MEANTIME, WE WELCOME YOUR INPUT AND FEEDBACK
WE FINISH OUR OWN DEMO CONSTRUCTION AND ADD ALL THE VIDEOS AND EXPERIENCE FROM
WHAT IS A SOLAR ENERGY MICROGRID
 A microgrid is a localized generating station to meet the power needs of a local community. In our case, the localized generating station generates power from solar and wind energy, called distributed energy resources (DERs). Typically, a microgrid is designed to meet the demands of the locality in “islanded mode” where the microgrid is running self sustained and off-grid. To ensure power at all times, the utility grid is still connected to the microgrid and drawn upon as needed.
Because solar and wind energy are intermittent in nature, the following equipment is used in the microgrid to efficiently deliver power:
- Converters – Convert direct current (DC) power to alternating current (AC) power
- Energy Storage – We’re recommending deep-cycle batteries
- Controllers – Designed for Depth of Discharge (DOD) and State of Charge (SOC) to lengthen equipment life span.
- Local Backup – e.g. Installing Diesel Generators in case the DERs do not provide sufficient power.
WHY OPEN SOURCE SOLAR
MICROGRID DESIGN AND SETUP
Our goal is to make solar an easier do-it-yourself project. Solar technology is not rocket science, but there are numerous technical terms and standards people should be aware of before implementing any changes to their energy infrastructure. To help with this while also teaching all that is needed for replication, we are open sourcing here everything for the Duplicable City Center and Earthbag Village Microgrid. As they occur, we will open source additional evolutions for the other 6 villages too.
The Duplicable City Center is designed with 12 visitor rooms and shared social spaces to accommodate approximately 200-300 people. The Earthbag Village consists of 72 individual residences to accommodate approximately 150 people. By open sourcing the process and details for the microgrid setup for these two constructions, and later the other 6 villages, food infrastructure, etc., our desire is to provide the knowledge necessary for:
- Duplication as part of any project replicating our designs
- Referencing as a starting point for similar but different projects
- Better understanding for any DIY solar panel installation project under consideration
WAYS TO CONTRIBUTE TO EVOLVING THIS SUSTAINABILITY COMPONENT WITH US
SUGGESTIONS | CONSULTING | MEMBERSHIP | OTHER OPTIONS
KET CONSULTANTS TO THE SUSTAINABLE ENERGY INFRASTRUCTURE
Doug Pratt: Solar Systems Design Engineer
Falgun Patel: Mechanical Engineer
Jeson Hu: Aerospace Engineer
Lam (Dave) T. Nguyen: Mechanical Engineer
Luis Manuel Dominguez: Research Engineer
Muhammad Sarmad Tariq: Electrical Engineer
Prabhath Ekanayake: Electrical Engineering Assistant
Ramya Vudi: Electrical Engineer
Robert Seton: Solar Design Engineer and Owner of Solar Hybrid Design
Ron Payne: HVAC/Thermal Designer and Mechanical Engineer
Satish Ravindran: Senior Mechanical and Industrial Engineer and LEED AP
Shravan Murlidharan: Electrical Engineer
Shreyas Dayanand: Battery Research and EV Charging Consultant
Shubham Agrawal: Electrical Engineer
Vicente J Subiela: Project Management Adviser
Yiwei He: Mechanical Engineer
Charles Gooley: Web Designer
Julia Meaney: Web and Content Reviewer and Editor
RELATED PAGES (Click icons for the complete pages)
")

![]()


![]()
SOLAR ENERGY
DESIGN & IMPLEMENTATION DETAILS
Off-grid energy infrastructures, also referred to as “microgrids,” are a non-conventional form of power generation that are becoming more and more popular for off-grid design and/or anyone concerned about grid stability. They work independently or in conjunction with the grid in order to reduce stress on existing infrastructure while strengthening grid resilience. Some of the advantages of microgrids are:
- Enhanced Reliability – They mitigate grid disturbances
- Efficiency of Delivery – They reduce energy losses in transmission and distribution
- Reduced Per-unit Cost – They bring down the cost of energy production
The concept of microgrids could be an energy game changer because they decentralize the conventional power system model. Every power system involves generation, transmission, and distribution. But in the case of microgrids, power is generated as close as possible to the distribution end. Thus the term “distributed energy resources” (DERs).
DERs are typically renewable sources of energy, the most widely used being solar and wind. These sources are readily available and among the most efficient sources. When part of a microgrid, they also offer always-on power through multi-mode backup options like grid-connection and/or backup generators, avoiding the sometimes significant expense of power outages.
Here we discuss details of micro-grid design and implementation with the following sections:
- Why Solar
- Where to Place Your Solar Energy Microgrid Setup
- Determining How Much Power to Produce With Your Solar Energy Microgrid Setup
- System Design and Equipment
- Placement / Distance Considerations
- Solar Sizing
- Choosing the Best Solar Hardware
- Calculations – Duplicable City Center
- Calculations – Earthbag Village
- Calculations – Intertie of City Center and Earthbag Village
- Penetration of the Microgrid
- Maintenance and Control
- Initial Cost Analysis
- Cost of Installed System
- Sample Cost Summary
- Future Considerations
- Resources
- Summary
- FAQ
The sun rises every day and even areas with large amounts of rain can provide solar energy. It is just a matter of how much and whether or not it is sufficient to justify the cost of solar over other energy options. Using free resources like Google’s Project Sunroof or NREL’s Solar Maps, you can check the viability of solar for your location. Our location shows solar is very viable and so is wind. If it is a good choice for your location you can also be happy about these additional solar benefits.
WHY SOLAR
There are many reasons to choose solar energy over less sustainable choices:
- Emission Free Technology: Power produced from solar panels has zero emissions, resulting in improved water quality and no additional CO2 added to our atmosphere.
- Fixed Energy Cost: Installing rooftop solar panels is looked upon as an investment. Unlike power from conventional sources, solar produces power at a fixed rate irrespective of the load demand. This helps provide homeowners an estimate on their utility bills and saves electricity. (Googles’ Solar Savings Estimator is a great tool if you’d like a fun way to start exploring the benefits of a rooftop solar project for any US address you input).
- Ease of Installation: Nowadays, rooftop solar panels are usually only needed to provide a few kilowatts to make sense for home use. They can be installed easily with proper equipment and standard safety measures.
- Net Metering: Smart meters now come with net metering, tracking solar power production while any excess power is fed back to the grid. Homeowners save money on their energy bills and in some states become eligible for additional incentives provided by utility companies for excess energy sent back to the grid. Here’s our related research: Solar Incentive Rates and Net Metering Research: West Coast States See also: Grid-tie Remote Energy Infrastructure Setup and Construction How-to Tutorial
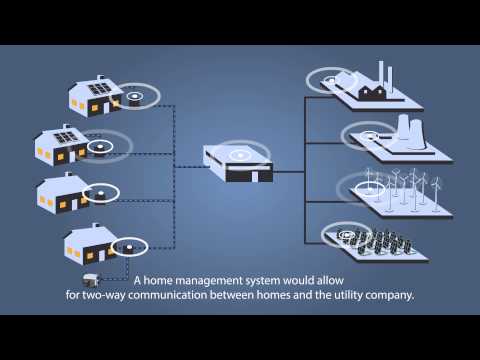
Here is a video about how microgrids work:

WHERE TO PLACE YOUR SOLAR ENERGY MICROGRID SETUP
 In order to acquire maximum power output from the panels, they need to get as much sun as possible. This means they should be placed somewhere without shadows, on the south side of structures, and at an an angle based on your site’s latitude.
This picture shows a general example of the difference in the Sun’s path and angle during the summer versus the winter:

Difference in the Sun’s Path And Angle During the Summer vs the Winter
The sun specifics for each location is different and these sites can be used to determine the best angle(s) for your panels.
Here is a more detailed image showing our location’s sun angles with an additional time of the year for the open source Tropical Atrium:

Sun Angles on the Tropical Atrium – Click for more information about this structure
Another consideration when setting up your microgrid is the distance from the grid to the point of use. The longer the distance (and hotter the temperature) the more potential for power loss. Longer distances (and increases in heat) are compensated by using larger (and more expensive) wire; but shorter distances are more efficient.
To further clarify and determine your own calculations, this website calculates voltage drop based on distance and temperature:
NoOutage.com
DETERMINING HOW MUCH POWER TO PRODUCE WITH YOUR SOLAR ENERGY MICROGRID SETUP
Power to be produced/generated is determined as a total of load demand (how much power is needed by equipment) and losses incurred (how much power is lost by equipment, wiring, etc.).
i.e. Generation = Load Demand + Losses
This is the conventional method of determining power production. With both a conventional grid and an off-grid (or grid-tied) microgrid, losses are categorized into fixed (guaranteed to happen) and variable (dependent upon system design). They occur due to heat dissipation.
Fixed losses would be:
- Unwanted heating of resistive components: The heating of resistive components caused by stresses on equipment and accounted for based on equipment specifications.
- The effect of parasitic elements such as resistance, capacitance, and inductance: The losses experienced within the circuits themselves and based on system requirements.
- Skin effect: Accumulation of charge on the surface of the conductors.
- Losses within the transformer: Eddy currents, hysteresis, unwanted radiation, dielectric loss, corona discharge, etc.
- Eddy Current: a localized electric current induced in a conductor by a varying magnetic field.
- Hysteresis: In this condition the magnetic induction lags behind the magnetizing force.
- Dielectric loss: This value quantifies dielectric (insulatory) materials’ inherent dissipation of electromagnetic energy mainly in the form of heat.
- Corona Discharge: This condition is observed as a glow around a conductor at high potential mainly due to ionization of air.
- Transmission and distribution losses: These are due to lengthy lines, conductor sizing, unbalanced systems, low power factor, load factor, overloading of lines, distance between distribution transformer and load center, etc.
Variable losses would be:
- Maintenance, expected and unexpected outages, energizing of equipment during peak and low demand hours, etc.
Note: As mentioned before, microgrids are installed on the distribution end – meaning installation and power collection happens where the power is needed. Thus, transmission losses are negligible.
MICROGRID TERMINOLOGY DIFFERENCES
In the case of a solar microgrid, the concept to determine the power generated is the same as a conventional grid: load + losses. The method and technical terminology used will be different though with a microgrid. This is because we are working with solar panels, batteries and inverters rather than traditional-grid generators, transmission lines, etc.
With a microgrid based on renewable, intermittent solar power, the following terminology is helpful to understand (and different from) a traditional grid-tied system:
- Insolation and shading of location: This term refers to the the amount of solar radiation reaching a given area.
- Capacity factor: The ratio of actual power generated over a year by the installed capacity.
- Storage system: Energy savings produced at one time for use at a later time. In the case of microgrids, deep cycle batteries are our recommendation.
- Inverter losses – This term depicts the efficiency of the inverter. Efficiency varies according to power used at the time and is generally greater with increased power utilization. An inverter uses some power from batteries even when it is not delivering any AC output, resulting in low efficiencies at low power levels.
- Conductor sizing: The size of the conductor plays a major role in the system losses. The resistance of the conductor decreases as the radius of the conductor increases. This is observed in the formula for resistance (R) in terms of resistivity (ρ), length (L), and radius (r) of the conductor:
R = ÏL / Ï€r2
Low resistance in turn, reduces the system losses. System losses are directly proportional to the conductor Resistance times Current (I) squared through the conductor as the constant factor:
System Losses = R x I2
- Efficiency of charge controller: Charge controllers regulate the voltage and current coming from the solar panels going to the battery. This helps prevent the batteries from overcharging. Therefore, their efficiency varies based on the battery charge.
- Solar panel I-V characteristic curves: demonstrate the current and voltage (I-V) characteristics of a particular photovoltaic (PV) cell, module, or array and give a detailed description of its solar energy conversion ability and efficiency. Knowing the electrical I-V characteristics (more importantly Pmax) of a solar panel is critical in determining the device’s output performance and solar efficiency.
The I-V graph below gives a detailed explanation of parameters to observe while determining the solar panel.

Explanation of Parameters to Observe While Determining the Solar Panel
Important parameters noted from the above I-V characteristic curve are:
- VOC = Open-circuit voltage: This is the maximum voltage that the array provides when the terminals are not connected to any load (an open circuit condition). This value is much higher than Vmp which relates to the operation of the PV array that is fixed by the load. This value depends upon the number of PV panels connected together in series.
- ISC = Short-circuit current: The maximum current provided by the PV array when the output connectors are shorted together (a short circuit condition). This value is much higher than Imp which relates to the normal operating circuit current.
- MPP = Maximum power point: This relates to the point where the power supplied by the array connected to the load (batteries, inverters) is at its maximum value, where MPP = Imp x Vmp. The maximum power point of a photovoltaic array is measured in watts (W) or peak watts (Wp). The Maximum power point trackers are programmed to tilt the panels according to the position of the sun during the day based on the MPP (= Imp x Vmp) value.
SYSTEM DESIGN AND EQUIPMENT
In the solar hardware system, harvesting hardware performs the most important function, which converts sunlight into electricity. A typical off-grid PV solar system looks like the figure below:

Typical Off-Grid PV Solar System – Click to open the image source in a new tab
Here are descriptions of all the equipment seen in the figure above:
- PV Module: These modules help convert sunlight (solar energy) to DC using the concept of photoelectric effect on PV cells, which are nothing but p-n junctions.
- Technical jargon explanation of a “p-n junction”: A p”n junction or diode is a boundary or interface between two types of semiconductor material, p-type and n-type, inside a single crystal of semiconductor. The “p” (positive) side contains an excess of holes, while the “n” (negative) side contains an excess of electrons.
- Solar Charge Controller: Solar charge controllers aid in implementing two kinds of control:
- Tracker control, also referred to Maximum Power Point Tracking (MPPT) of the panels and,
- The state of the Battery: Battery State of Charge (SOC) and Depth of Discharge (DOD).
- Inverter: Semiconductor equipment that helps convert DC power produced at the panels to AC to meet the load demand.
- Battery: Solar being an intermittent source of energy (only available when sunny), can be used to charge batteries that help meet the load demand in cases of insufficient or absent sunlight for solar.
- Load (AC and DC): Appliances connected to the system act as load. Most residential loads require AC. The use of DC is seen in charging batteries with the help of DC-DC converters. In our design we run a DC backbone of 24V for the converters implemented in control and automation.
- Auxiliary Energy Sources/Local Backup: This source is to act as a substitute for the primary source of energy, which in this case is solar. For this particular microgrid infrastructure we decided to go with diesel generators.
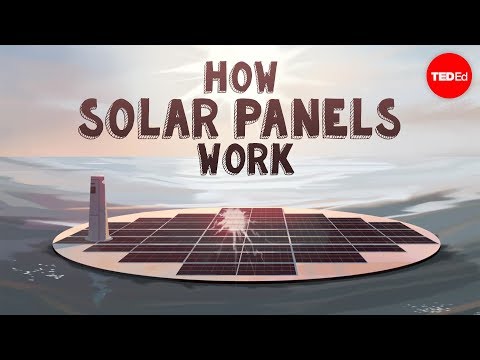
To help with further understanding, here’s a video about how solar panels work:
This idea of a solar microgrid can be expanded to a solar/wind hybrid design as well. We know that solar and wind are complementary sources of energy and an analysis of a wind microgrid has been performed as well.
To meet the needs of both the Duplicable City Center and Earthbag Village, an intertie between the two has been designed for redundancy and reliability reasons. Any variability in the demand of energy in one structure can therefore be met with the help of power generated from the other structure(s) and vice versa:

Duplicable City Center and Earthbag Village, an Intertie
PLACEMENT / DISTANCE CONSIDERATIONS
In case of expansion, an economical design should also take into consideration the following factors related to placement:
- The voltage drop at the output of the inverter: There is no ideal suggested distance between the microgrid and loads. But irrespective of the distance, voltage drop at the output of the inverter should be calculated. Based on the inverter manufacturer used, a voltage drop of 2-3% is allowed. This factor increases the inverter’s accuracy to maximum power point tracking and makes the system more efficient.
- Conduit design: The conduit designed to carry current from the system to the loads should be designed in such a way that the filling of the conductors is not more than 80%. Proper sizing can be found from a conduit fill chart and, in case of trenching, it can be a good idea to go one size higher on the chart.
- Tying the systems together: In terms of better design, it is economical to tie the existing system to the new one. This improves reliability and stability for the power being produced. One of the major aspects to remember during implementation is the design of wire and conduit tying the two areas together (Area 1 for the existing systems and Area 2 the new system). Make sure the wire used is designed for the worst-case scenario.


VIDEO COMING OF: SYSTEM EXPANSION PROCESS – THIS TUTORIAL WILL SHARE WHAT WE LEARNED ABOUT PLACEMENT AND INTERTIE SETUP FROM OUR OWN EXPANSION PROCESS
SEE OUR HOW TO HELP AND/OR CROWDFUNDING CAMPAIGN PAGE TO HELP CREATE ALL THE TUTORIAL VIDEOS FASTER
SOLAR SIZING
The sizing of each equipment component in the microgrid design is calculated from the base data for total consumption (click here for our spreadsheet). In our case, the system design is an intertie, so the initial system is based on the calculated consumption of the Duplicable City Center combined with that of the Earthbag Village. Additional expansion will also occur with the construction of Villages 2-7, but the initial solar setup will provide all the power needed for the Duplicable City Center, Ultimate Classroom, Earthbag Village, and Phase I food infrastructure.
With our own system as an example, we discuss here the details of sizing a solar system with the following sections:
- Foundational Calculations
- Read Me
- Energy Demand Template
- Energy Demand for Earthbag Village, Duplicable City Center, Ultimate Classroom & Straw Bale Village
- Duplicable City Center
- Ultimate Classroom
- Earthbag Village
- Straw Bale Village
- Additional Factors Affecting Equipment Selection
FOUNDATIONAL CALCULATIONS
The first step to calculating solar-sizing specifics is to identify the total power consumption. The total consumption is the sum of individual equipment consumption for each area of interest: Duplicable City Center, Ultimate Classroom, Earthbag Village, and Straw Bale Village. The energy demand for each area is calculated using this template within the Solar Sizing – ENERGY BALANCE (on grid) spreadsheet. This spreadsheet has multiple tabs that all have their own unique purpose and are listed below:
- Readme
- Energy Demand Template
- Energy Demand for Earthbag Village, Duplicable City Center, Ultimate Classroom & Straw Bale Village
READ ME
The first tab is called “Readme” and contains an overview of the basic content within the spreadsheet and a description of the specific tabs for the energy demand analysis.
This spreadsheet distinguishes values that are input by the user as cells highlighted green. The rest of the spreadsheet uses formulas to derive outputs and generate models that visually communicate the data in an effective manner.
ENERGY DEMAND TEMPLATE
The Energy Demand Template tab is an example of how all the “Energy Demand” tabs are structured. Detailed data of loads (watts) and time of use (hours) are cataloged to calculate the energy demand (kWh). The template tab contains many sections and formulas that are all defined below:
General Class of Item (Column A, Rows 5 – 12)
‘General Class of Item’ are user defined categories that energy draws can fall into, such as pumps, lighting, etc. You can change this and add other classes as needed, just Insert row between the existing list so pull down in column D automatically includes your updates.
General Areas (Columns C – E, Rows 5 – 12)
‘General Areas’ are user defined areas of space solar energy is being supplied to, such as bathrooms, kitchens, etc. Again you can change this and add other classes as needed, just Insert row between the existing list so pull down in column E automatically includes your updates. If you know the square footage of each area, you can enter that as well as the quantities of each area. These can be used for heater and cooling estimates.

Areas of Space Solar Energy – Click to open the open source spreadsheet in a new tab
Electrical Items (Columns A – AR, Rows ~15 to ## – number of rows depends on the the number of items drawing energy for the particular site)
For each item that requires electricity, the following data are needed and the explanations below describe the headings in aquamarine cells:
Data Source (Column A)
‘Data Source’ is a catalog of where the energy data was extracted from. For example for the selected dryer for the City Center, this PDF specifies a nominal energy draw of 5,300 watts. So, the link to that PDF would go in this cell of the spreadsheet.
Energy Draws (Column C)
‘Energy Draws’ are an itemized list of components drawing energy. Here a descriptive name is provided so we know what item is needing to be supplied electrical energy. For example: Clothes dryer(s).
General Class of Item (Column D)
‘General Class of Item’ is a pull down menu that can be formulated with the classes of items of interest. This makes sorting easier, if there is an interest in knowing what types of items, such as lighting, heating/cooling, water heaters, etc., are drawing the most energy. This list can be modified by the user by editing Column A, Rows 5 – 12 – see above (add link to General Class of Item (Column A, Rows 5 – 12) section above).
Areas (Column E)
‘Areas’ is a pull down menu that can be formulated with the areas of interest such as different sections of the living space (Dining room, Natural pool and spa, living room, bedrooms, kitchen, laundry room, bathrooms, game rooms, etc.). This list can be modified by the user by editing Column C, Rows 5 – 12 – see above (add link to General Areas (Columns C – E, Rows 5 – 12) section above).

Different Sections of the Living Space – Click to open the open source spreadsheet in a new tab
Time Matrix (Column F ” AC)
‘Time Matrix’ represents the pattern of use of each load over 24 hours. Below this header are the number of hours in a day. The ‘1’ means the first hour, ‘2’ the second and so on. The user inserts in each cell the character “s” in case the appliance is ON just during summer, “w” when it is only ON during winter, “b” when it is ON in both seasons, and the cell is left blank when it is OFF. The color of the cell updates automatically. The first row is an example record. To summarize:
Empty cell = the load is OFF
- “s” = the load is ON only in summer
- “w” = the load is ON only in winter
- “b” = the load is ON in both seasons

Seasonal Operating Time Totals – Click to open the open source spreadsheet in a new tab
Seasonal Operating Time Totals (Columns AD ” AH)
These columns summarize the hours of use in each scenario (summer, winter, both) and the average hours of operation across both seasons. This average value gives an indication of the yearly usage as it gauges the average value during the two seasons of the year. For instance:
- Lighting: It is expected that lighting is used more often in winter than in summer and not expected to be used only in summer. That is why there is no “s”.
- Water heater for showers: It is estimated that the heater will be available along typical showering periods, plus one hour around 2pm in the summer.
- Washing machine: The estimation considers that the washing activity is concentrated at the beginning of the day (associated with low electricity price time).
- Drying machine: It is considered that it will be used only in winter, since the open air under sunny days will be the cheapest drying option for summer. Time of use is just after the washing machine.

Operating Time Totals – Click to open the open source spreadsheet in a new tab
Unitary Power (Column AI)
This column labeled ‘Unitary Power’ is an input value and represents the power in watts of a single unit under the description. If this process is hard to estimate, you can use this energy calculation demand, considering 1 day per year.
Number of Units (Column AJ)
This column labeled ‘Number of Units’ is also user defined and is the quantity installed of the energy draw item. This value represents the number of components that utilize the unitary power.
Total Installed Power (Column AK)
This column (‘Total Installed Power’) contains an equation that is the values in ‘Unitary Power’ multiplied by the value in ‘Number of Units’ for a given item. This multiple represents the total power drawn from the line item, and the units are kilowatts.
Maximum and Minimum Expected Percentage of Power (Columns AL and AM)
These values are an approximation to take into account that the appliance could operate within a range different from the nominal power. This will depend on the use habits for each appliance/load. For example:
- Lighting: The lights are dimmable, so when ON using the brightest setting, the power draw is 100%, which is the nominal power. When ON using the dimmest setting, the power draw is 60% of the nominal power.
- Washing machine: When used at most energy intensive settings, the percent draw is 100% of the Unitary Power, whereas it is 60% energy consumption when using cold water.
- Drying machine: When used at most energy intensive settings, the percent draw is 100% of the Unitary Power, whereas it is 60% energy consumption when using an eco setting.
- In case of unknown values, use 100% for both.

Power Usage – Click to open the open source spreadsheet in a new tab
Demand (Columns AN ” AP)
These values are a calculation of energy demand that takes into account the nominal load, the number of units, and the average expected duration of use during a 24 hour period. The maximum, average, and minimum energy demands for each line item is reported using the maximum and minimum expected percentage of nominal power consumption. The energy demand values are reported in kWh/day.
Demand per Residence (Column AQ)
This column represents the maximum demand per residence to have an understanding of the specific demand of each load relative to the population.
High Demand Level (Column AR)
This column is used to identify which loads are over a certain demand. The target demand value can be changed by the user. Wherever the daily demand of a load is over the target demand, the cell color turns into yellow and the value shifts from ‘0’ to ‘1.’

Energy Demand – Click to open the open source spreadsheet in a new tab
Check (Column AH)
This column is meant to serve as a verification for review of data collected for the spreadsheet. A check mark implies that the data have been reviewed and approved.
TOTALS and Other Statistics (Rows 26 to 34)
The rows at the end of the itemized list, ‘TOTALS’ are provided, which are overall power draws and details for the overall site. Additionally, the power draw statistics for each hour of the day is provided by season. An enclosed chart is plotted automatically to see the evolution of the load demand along the day and identify the maximum demand point for each season.

Total Energy Usage – Click to open the open source spreadsheet in a new tab
ENERGY DEMAND FOR EARTHBAG VILLAGE, DUPLICABLE CITY CENTER, ULTIMATE CLASSROOM, & STRAW BALE VILLAGE
These tabs are all created to uniquely summarize the site demand and the corresponding details of each location using the “Energy Demand” template. You can see these calculations here:
- Duplicable City Center on this spreadsheet: Solar Sizing – Energy Balance (on grid) purpose
- Ultimate Classroom on this spreadsheet: Energy Demand for the Ultimate Classroom
- Earthbag Village on this spreadsheet: Energy Demand for the Earthbag Village
- Straw Bale Village on this spreadsheet: Energy Demand For The Straw Bale Village
DUPLICABLE CITY CENTER
The following is the energy demand of different areas at Duplicable City Center location, provided in tabular and graphical form:

Area/Energy Demand – Click here to open the open source spreadsheet in a new tab

City Center Average Energy Demand In Each Area – Click to view source
The following is the energy demand of different item categories at Duplicable City Center location, provided in tabular and graphical form:

Item Categories/Energy Demand – Click to open the open source spreadsheet in a new tab

City Center Average Energy Demand of Each Category Item – Click to view source
ULTIMATE CLASSROOM
The following is the energy demand of different areas at Ultimate Classroom location, provided in tabular and graphical form:

Area/Energy Demand In Each Room – Click to open the open source spreadsheet in a new tab

Ultimate Classroom Average Energy Demand in Each Area – Click to view source
The following is the energy demand of different item categories at Ultimate Classroom location, provided in tabular and graphical form:

Item Categories/Energy Demand – Click to open the open source spreadsheet in a new tab

City Center Average Energy Demand of Each Category Item – Click to view source
EARTHBAG VILLAGE
The following is the energy demand of different areas at Earthbag Village location, provided in tabular and graphical form:

Earthbag Village Area/Energy Demand – Click to open the open source spreadsheet in a new tab

Earthbag Village Average Energy Demand in Each Area – Click to view source
The following is the energy demand of different item categories at Earthbag Village location, provided in tabular and graphical form:

Earthbag Village Energy Demand – Click to open the open source spreadsheet in a new tab

Earthbag Village Average Energy Demand of Each Category Item – Click to view source
STRAW BALE VILLAGE
The following is the energy demand of different areas at Straw Bale Village location, provided in tabular and graphical form:

Straw Bale Village Energy Demand – Click to open the open source spreadsheet in a new tab

Straw Bale Village Average Energy Demand in Each Area – Click to view source
The following is the energy demand of different item categories at Straw Bale Village location, provided in tabular and graphical form:

Straw Bale Village Energy Demand – Click to open the open source spreadsheet in a new tab

Straw Bale Village Average Energy Demand of Each Category Item – Click to view source
POWER DRAW > 400 KWH/DAY
As mentioned previously, these spreadsheets contain information pertaining to the site and its power requirements by component. This particular spreadsheet allows the user to assess the most demanding components of the site and provide additional insight on which components are demanding the most energy. The user copies and pastes any cells that have ‘1.0’ and yellow colored cells in Column AR of the Energy Demand Tabs. In the current state, the most demanding components have been classified as above 400 kWh which includes the following:
Duplicable City Center
- HVAC Winter
- HVAC Summer
- Boiler
Straw Bale Village
- All Residence Hot Plates
- Water Heaters for Bathrooms
- HVAC Winter
- HVAC Summer
- Boiler
HVAC
The HVAC units are one of the most demanding components of the sites as they utilize a great deal of energy to provide heat, cooling, and airflow to the site year-round. This level of energy demand is expected when creating an environment that is independent of the true weather conditions no matter how extreme the climate may be. The units generate and distribute the desired air temperatures through ventilation systems that are constantly adjusting flow rates to provide the correct amount of distribution to prevent overreactions to the temperature adjustments.
These units utilize a significant amount of power, but due to the constant feedback loop, this is to be expected and is a necessary aspect of the site design no matter what season it is. Temperatures change year round, with hot and cold days fluctuating, making real time response quintessential. The size of the Duplicable City Center and Straw Bale Village is the driving factor for the demand surpassing 400 kWh. This is completely reasonable and understandable due to the continuous monitoring and adjustment loop enabling the activation and sustained powering of the heating or cooling unit.
Water Heaters
The Straw Bale Village will utilize water heaters for bathrooms and kitchens alike. Similar to the demand generated by the HVAC systems, the heating of water is variable based on what the users need at a given time. These varying desired temperatures will require more or less power to provide the adequate heat level. Heated water is generally used in sinks, showers, dishwashers, and washing machines which are all supplied by the water heater. For this circumstance, it will be the sink and shower usage for each resident.
The anticipated heating load for the Straw Bale Village is based on the following usage calculation:
= 156 residents*(0.35 gpm sink flow rate*8.5 min used+7.2 gallons/shower)
= 1586 gallons
The driving factor of heating is the total number of residents and the average hot water usage from each. This multiplier substantially increases the energy demand utilized and provides a reasonable explanation to the significant load put on the community grid. The large volume of water is what drives the load to exceed 400 kWh.
Hot Plates
Each residence of the Straw Bale Village will contain a hot plate to serve as a small kitchen. These appliances will likely not all be used at the same time, but in the event that they are, the total will exceed the 400 kWh threshold. The hot plates utilize around 468 kW over the 102 total residences at an estimated usage of 3 hours per day. This scenario estimates higher usage in order to adequately manage the expectations of the site’s needs.
Boilers
Boilers provide large scale water heating for the Duplicable City Center and Straw Bale Village. They are targeted towards the overall site needs at locations that are not within the bathroom. This could be the aforementioned sinks, dishwashers, and washing machines that need heated water. The water heaters target the sinks and showers of the residence as the temperature of the water is adjusted more finely. The boilers are less precise but more efficient in their delivery of volume. The generated demand by these boilers is treated similarly to the water heaters where the sizing approximates the maximum usage for two boilers at each site. These use over 1,000 kWh of demand when fully operational, thus exceeding the 400 kWh threshold.
DEMAND TOTALS
The Demand Totals tab is crucial to understanding the overall impact of each major zone within One Community. The “Demand Totals” tab summarizes the demand generated by each site at each hour of the day. This summary is categorized by winter and summer as well as maximum, average and minimum usages. The goal of this spreadsheet is to understand the total energy that needs to be supplied and how it varies each day. As the demand increases throughout the day, the peak hours are relieved by the solar output of the solar system.
The hourly maximum and average total demands during summer and winter can be realized in the graphs below:

Maximum Summer Demands by Hour – Click to view spreadsheet

Maximum Winter Demands by Hour – Click to view spreadsheet

Average Summer Demands by Hour – Click to view spreadsheet
The daily and monthly total energy demands are shown below:

Maximum, Minimum, Average Winter & Summer Daily Total Demands

Maximum, Minimum, Average Winter & Summer Monthly Total Demands
The distribution among locations is also provided in tabular and graphical form:

Daily Energy Demand Distribution – Click to open the open source spreadsheet in a new tab

Max Winter Energy Usage

Max Summer Energy Usage

Mean of Averages Energy Uses
INVERTER SIZING
As mentioned above, inverters are the equipment that help convert DC power produced at the panels to AC to meet the load demands of all the standard equipment in the building(s), which is all AC powered. This is important because DC power will not power this equipment.
With this in mind, the input rating of the inverter is selected so it is greater than the total power consumed by all the connected appliances. This value is typically 25-30% more than the total power consumed by the appliances. This 25-30% addition assures needs are met even during the most extreme energy demands, assuming to never exceed 25-30% beyond your calculated maximum.
BATTERY SIZING
As mentioned earlier, batteries come into the picture incase of insufficient power or absence of solar. Besides the consideration of price, capacity, and voltage, battery-sizing is necessary for off-grid solar PV infrastructure. Solar PV systems typically require deep cycle batteries. These batteries have an advantage of rapidly charging and discharging to a low energy level, making them highly efficient. Batteries are rated in Ampere-hours. To find the Ampere-hour rating for a given solar PV system calculate the per-day consumption of appliances in watt-hours. The standard loss in batteries is typically 20%. This accounts for the charging and discharging cycle losses. Taking this into account, a loss factor of 1.2 is included in the total power supplied = 1.2 * Total Wh/day.
Draining batteries completely is not advised as it decreases their lifespan. The Depth of Discharge (DOD) should not exceed 60% of the charge. This means the battery can be discharged till 60% of its energy has been delivered. Maintaining this helps increase their lifespan.
Taking into account 60% of the delivered energy, a factor of 1.6 is included in the total power supplied by the battery = 1.6 x 1.2 x Total Wh/day. The nominal DC voltage of a battery is the same as that set for the inverter. Considering economic and technical factors we have set the nominal voltage at 24 V, as further explained in the controls section. For any off-grid Solar PV System it is not advisable to charge and discharge the batteries every day. The “days of autonomy” designs the battery rating based on the number of days the batteries deliver power without a charge.
Now that we have all the parameters required to calculate the Ampere-hour rating of the battery, the following formula is applied:
 * Days of autonomy / nominal voltage")
CHARGE CONTROLLER RATING
Charge controllers increase efficiency and lifespan of the batteries and the technology implemented in these controllers continuously evolves. We considered two factors in their design rating:
- The type of charge controller ” Available in series and parallel
- The I-V characteristics of the solar panel

Photovoltaic Array Voltage / Current Characteristic
Relative to the I-V characteristics, the charge controllers are set at a rating of 1.3 x The Short Circuit Current. This procedure is implemented in the excel sheet where there is a detailed analysis of the cost estimates.
ADDITIONAL FACTORS AFFECTING EQUIPMENT SELECTION
Here are additional considerations to include when selecting equipment. We will add more if our experience purchasing and installing our system reveals anything beneficial.
SOLAR PANELS
Three variations of solar panels are generally utilized for residential and commercial purposes: monocrystalline, polycrystalline, and thin film. They vary in silicon content, efficiency, area required, and cost, with preference given to the latter two.
INVERTER
The calculations for inverter sizing help decide the inverter to be chosen. Cost and the project budget aid in choosing an inverter as well.
BATTERIES
As previously mentioned, deep-cycle batteries are preferable for PV systems; other factors include price, capacity, and voltage.
CHOOSING THE BEST SOLAR HARDWARE
In order to determine the best solar hardware, we identified the types of solar hardwares, their characteristics, and whether or not they meet One Community’s needs.
The solar hardware discussed below can be broken into two categories: harvesting and inverters. Other hardwares like electrical panels, transformers, and AC and DC circuits are not specifically designed for the use of solar energy and common in the market. The estimate of their costs is included in the cost section.
We discuss with the following sections:
- Types of Solar Cells
- New Solar Harvesting Techs
- Recyclability
- Solar Harvesting Hardware Summary
- Solar Inverters
- Solar Inverter Hardware Summary
TYPES OF SOLAR CELLS
The industry currently categorizes solar cells into three generations: the first, second, and third generation.
- First generation: Silicon based. Dominated the solar cell market around the world for their relatively high efficiency, longer lifetime, and maturity.
- Second generation: Thin-film solar cells. They are made of semiconductor materials that are only a few micrometers thick each. They have an easier manufacturing process, and are sold at lower prices, but usually have lower efficiency and shorter lifetime.
- Third generation: All newly developed solar harvesting technology. They include, but are not limited to, advanced thin-film, concentrated PV cells, concentrated solar thermal, and perovskite solar cells. Some still need further research and development to mass produce and become cost efficient.
The image below describes the characteristics, advantages, and disadvantages of each type of solar harvesting hardware.

Solar Panel Type Comparison – Click to open the open source spreadsheet in a new tab
MONOCRYSTALLINE SOLAR PANELS
- Highest efficiency given by monocrystalline silicon purity (Best ones above 20%)
- Longer lifespan: Higher temperature tolerance than most other types of solar panels (30 ~ 50 yrs)
- Expensive price: Slightly more expensive than polycrystalline and much more expensive than thin-film solar panels

Monocrystalline Solar Panels
POLYCRYSTALLINE SOLAR PANELS
- Faster and cheaper manufacturing process
- Lower cost
- Lower power efficiency (15-17%)
- Shorter lifespan (~35 yrs) due to their sensitivity to higher temperatures

Polycrystalline Solar Panels
Monocrystalline or Polycrystalline?
Monocrystalline offers higher space efficiency, power conversion efficiency, and lifespan, but these advantages come at a higher price with the power outputs remaining in the same range.
THIN-FILM SOLAR PANELS
- Easier manufacturing process which can reduce the cost
- Fewer materials – Only very thin layers are deposited on substrates
- Flexible property: Able to open their use to applications on curved surfaces
- Better performance at high temperatures than the silicon based cells
- Low efficiency causes larger quantities of demand to take up more space
- Shorter lifespan (~15 yrs)
For information about nano manufacturing processes, see the following:
Glow discharge: DC Glow Discharge Plasma
Sputtering: Magnetron Sputtering – Overview
Evaporation: Electron Beam Evaporation – Overview

Thin-Film Solar Panels
ADVANCED THIN-FILM: COPPER INDIUM GALLIUM SELENIDE (CIGS) THIN-FILM
- The third generation thin film solar cell and a relatively new technology
- Made by layering copper, indium, gallium, and selenide on top of each other which can efficiently convert sunlight into electricity
- Versatile material: Can be deposited on substrates like glass, polymer, or metal foil
- Allows flexibility due to metal foil and polymer
- The most efficient thin film solar cell
- High cost of production due to the short development time for this technology
NEW SOLAR HARVESTING TECHS
Most third-generation solar panels are still in the research and development phase. Some of them use organic materials, and others add inorganic substances. Below are the types of third generation solar panels that have already shown promising results.
CONCENTRATED PV CELL (CPV)
The principle is to focus a larger area of sunlight onto a smaller area, one containing a high-efficiency solar cell. However, the drawback is that the lenses need to be orientated directly towards the sun, which usually requires a tracker to implement.
There are two types of optics used in CVPs:
1. Transmissive: Where fresnel lenses are used most often.
: normal lens and fresnel lens")
Transmissive Concentrated PV Cell (CPV)
2. Reflective: Cassegrain telescopes are most often used for less complex solar cell placement.
: simple reflective design and cassegrain design")
Reflective Concentrated PV Cell (CPV)
ADVANTAGES
- High-efficiency: Efficiency can reach 46% when using multiple junction cells
- Stable performance under high temperature (100°C +)
- Durability: Its low thermal degradation leads to a longer lifespan (25 yrs +)
- Larger tracker structure can allow ground operation below
- Recyclability: Mostly made of inorganic material that can be fully recycled
Larger Tracker Structure
DISADVANTAGES
- High initial capital cost: 2.5 to 4 times more than traditional Silicon PV panels
- Higher maintenance fee: The need for high precision tracking leads to more maintenance cost and cleaning can be harder due to the height of the trackers
- Operation time limited by weather: CPV can work only with direct sunlight
- Low land occupation density: Trackers are installed meters apart to avoid shadowing from each other (50% of land use)
CONCENTRATED SOLAR THERMAL TECH

Concentration Solar Thermal System
With concentrated solar thermal technology, sunlight is focused and reflected to a heat collector to store and be used to generate power. The system consists of three parts. First, a field of mirrors that reflect sunlight to a high, above-ground light receiver. Second, the light receiver collects the heat of sunlight and stores it in working fluid. Third, working fluid goes through a heat exchanger to heat up the generator and produces electricity.
ADVANTAGES
- Energy can be stored in less expensive working fluid for long period of time
- Heat energy is ready to be converted to electricity anytime
DISADVANTAGES
- Multiple component maintenance (mirror field, central towel, heat exchanger, and steam turbine generator)
- Needs large, clear space for direct sunlight and reflective route
- Requires large amount of water to cool the generator system
RECYCLABILITY
Recyclability for renewable energy is another important factor for solar cell choosing. An ideal product should be mostly recyclable, utilize minimal natural resources, and produce as little greenhouse gas as possible. The image below is a recycling process map for silicon based (left) and thin film based (right) solar cells. For more information about recycling processes visit The Opportunities of Solar Panel Recycling.

Recycling Process of Silicon Based (Left) and Thin-Film Based (Right) Solar Cell
MONOCRYSTALLINE
Monocrystalline solar panels are made of three main components, all of which are highly recyclable.
, glass (95%), and metal (100%)")
Crystalline Cell Material Recyclability
POLYCRYSTALLINE
Similar to monocrystalline, around 90% of polycrystalline cell materials are recyclable.
THIN-FILM
Thin-film solar panels will be shredded into 4-5mm particles to break the lamination, and separated to solid and liquid parts in a rotating screw for further separation and purification. According to greenmatch.co.uk, semiconductor material can be 95% recycled, and 90% of glass can be recycled.
CONCENTRATED SOLAR THERMAL
Most centralized solar thermal plants can be recycled because they are mainly metal and mirrors, but in the energy transfer process, there are by-products such as working fluid, incineration residue, contaminated soil, etc.
The recycling process requires high-‹temperature, high energy consumption, and these processes are expensive.
CONCENTRATED PV CELL
Concentrated PV cells are made of the same material as silicon based solar cells, but use more glasses to focus sunlight, and a large metal tracker. Similar to mono and poly-crystalline solar cells: 85% of silicon wafer, 95% of glass, and 100% of metal can be recycled.
SOLAR HARVESTING HARDWARE SUMMARY
Thin-film is not a solar power plant option due to its lower efficiency and shorter lifetime. The choice lies between mono and poly-crystalline solar cells, enhanced thin film solar cells, concentrated solar thermal (CST), and concentrated PV cells (CPV).
A detailed quote from each company is needed to make the decision on which one is best. A list of accredited companies and their product is provided in the Solar Equipment and Company Analysis Table for future reference, and the image below is a screen shot of the table:

Solar Panel Type Comparison – Click to open the open source spreadsheet in a new tab
As of now, only First Solar and Arzon Solar responded to our requests for quotes. First Solar’s series 6 is an advanced thin film solar panel. They quoted $961,245, including module support racking, inverters, and solar modules. Arzon Solar uses two axis tracking systems with concentrated solar panels and quoted a much higher price: $2.8 million. In addition, First Solar has a 30-year performance warranty and Arzon Solar’s is 25-year. With these comparisons, it is clear that First Solar is the optimal provider.
SOLAR INVERTERS
In a solar energy system, inverters are used to convert DC power from solar arrays into usable AC power. While doing this, inverters monitor the solar array for its performance, and can be used to diagnose the solar array system. Therefore, inverters are treated as the brains of the solar energy system. There are four types of inverters: string, central, micro, and battery-based inverters, ordered from the most popular to least.
STRING INVERTERS
String inverters are the most popular type of solar inverter. They connect a series of solar panels and convert their DC power to usable AC power. Depending on the size of the project and string inverter capacity, each string inverter usually connects to fewer than 10 solar panels.

String Inverter Setup
ADVANTAGES:
- When managing a smaller section, there is lower risk of a large power outage. If one string inverter is down, it affects only the section it controls.
- More control to the panels which leads to optimal productivity of solar panels.
- Easier to repair and fix.
- High modularity: Easy to adapt to the PV field and extend the generation system when necessity.
DISADVANTAGES:
- The cost is proportional to the scale of the solar farm when connecting more string inverters.
CENTRAL INVERTERS
Central inverters connect a great number of panel strings simultaneously. Solar panel strings are connected together in a combiner box which directs the DC power to the central inverter. Then, the central inverter converts incoming DC power to AC power.

Central Inverter Setup
ADVANTAGES:
- Lower cost per watt compared to string inverters, favorable for large projects 20MW+.
DISADVANTAGES:
- Less individual panel production control which leads to less productivity.
- Difficult repair and expensive maintenance: they require a specially trained expert to fix central inverter problem.
- Instability: In the case of an inverter problem, we would lose all power controlled by the central inverter.
- Large size and weight: specific transport and foundation are required.
MICROINVERTERS
Microinverters’ each microinverter is connected to one or a few solar panels. The benefit is that each solar panel can be connected to a separate microinverter or “brain.” When a few solar panels are shaded, their underperformance would not affect other ones to achieve optimal power output.

Microinverter Setup
ADVANTAGES:
- Systems with microinverters can be more efficient than string inverters as it optimizes the production of each panel.
- Low repair and exchange cost.
- Easy installation: Some manufacturers already integrate microinverters into their solar panels.
DISADVANTAGES:
- The same solar energy field would need many microinverters, which increases the cost and installation time.
BATTERY-BASED INVERTERS/CHARGERS
Battery-based inverter/chargers are designed for off-grid solar energy systems, where the solar energy is stored in local batteries. Due to the frequent charge and discharge of the battery system, it has a battery charger integrated into the inverter to operate the battery system.

Battery-Based Inverter Setup
This battery-based inverter/charger manages and monitors the power input and output between the grid and the solar panels to charge the local batteries. So the decision power usage in each moment is left to the control software, this software’s main goal is to keep a stable frequency and voltage and balance the power (inputs = outputs).
SOLAR INVERTER HARDWARE SUMMARY
The table below compares each type of solar inverter, their characteristics, advantages, and disadvantages to determine which is the best inverter type for their needs. Below is a screenshot of the table.

Solar Inverter Comparison Table – Click to open the open source spreadsheet in a new tab
In addition, a list of solar inverter companies and their products are listed in The Best Solar Inverter Research Table, where their price and product specs are compared to each other. The compared specs include maximum power input, maximum power output, output voltage, warranty, efficiency, and more. The image below is the screenshot of the table.

The Best Solar Inverter Research Table – Click to open the open source spreadsheet in a new tab
CALCULATIONS FOR THE DUPLICABLE CITY CENTER
Following the above-mentioned procedures, these figures were obtained for the sizing of the PV system equipment for the Duplicable City Center. The process continues to evolve though and our most current calculations can be found on the Google Spreadsheet.
SOLAR PANEL SIZING

Solar Panel Sizing Table – Click to open the open source spreadsheet in a new tab

Battery Sizing Table – Click to open the open source spreadsheet in a new tab
CALCULATIONS FOR THE EARTHBAG VILLAGE
These calculations have not been completed yet. If you have the necessary knowledge and experience and would like to help complete them, click here for the application to join our team.
CALCULATIONS FOR THE CITY CENTER AND EARTHBAG VILLAGE INTERTIE
These calculations have not been completed yet. If you have the necessary knowledge and experience and would like to help complete them, click here for the application to join our team.
PENETRATION OF THE MICROGRID
Penetration of the microgrid is a combination of:
- Supplying power in remote locations while the microgrid (and other construction) is completed
- Building the necessary infrastructure in preparation for contingencies
Both of these are addressed in detail with the step-by-step self-sufficiency phase-in for 20-400+ people plan shared on the Highest Good Energy open source hub: highest good energy phase-in.
MAINTENANCE AND CONTROL
While this system is designed as largely automatic and self-sustaining, there will be one or more designated maintenance and service personnel for the community. This person will be in charge of system operations and trained to troubleshoot all aspects of the system. Additionally, a great deal of system automation is possible with the Sunny Islands components. As battery charge drops to critical levels, the Island can initiate start-up of backup generators, and/or shut down selected loads (the hot tub for instance).
Routine maintenance includes cleaning PV arrays, securing battery cables, and monitoring the Multi-Cluster for any warnings or problems. For this reason, someone dependable and knowledgeable will be “in charge” of the system at all times. When our maintenance plan is completed and tested, we’ll add here the maintenance schedule, video tutorials for all maintenance processes, and anything else we believe to be helpful.

VIDEO COMING OF: COMPLETE SOLAR MAINTENANCE ” THIS TUTORIAL WILL SHARE OUR COMPLETE MAINTENANCE AND UPKEEP PROCESS FOR THE ONE COMMUNITY SOLAR SYSTEM
SEE OUR HOW TO HELP AND/OR CROWDFUNDING CAMPAIGN PAGE TO HELP CREATE ALL THE TUTORIAL VIDEOS FASTER
INITIAL COST ANALYSIS
To calculate the initial cost, we discuss with the following sections:
COST OF INSTALLED SYSTEM
The image below contains graphs from NREL showing the cost of different installed solar systems for residential, commercial, utility scale fix-tilt, and utility scale one-axis tracker during the last 10 years.

Cost of Installed System From NREL
For the city center project, an estimated 4,216 solar panels are to be used with each providing 450 W of power. Therefore, the total output of the system is 1,897,200 W of power. The size of the project is between the commercial and utility scale in image 11 above ($0.94/W ~ $1.72/W). The power plant for the first two phases of One Community (Villages 1 and 2, food infrastructure, Ultimate Classroom, and Duplicable City Center) would cost between $1.78 – $3.26 million.
The image below is the LCOE stands for “levelized cost of energy”, which shows a decreasing trend of the LCOE for residential, commercial, and utility scale photovoltaic systems.

RNEL PV LCOE Benchmark Summary
According to NREL, the LCOE for utility-scale PV in 2020 is $0.05/kWh. For the City Center needs, we project 10.51 kWh per person per day, which gets an average of $15.80 / month for each person spent on energy.
In the U.S. according to move.org, the average cost of electric bill per person would be $43.35. Compared with the City Center solar farm project LCOE of only $15.80. Therefore, we can say that a City Center solar farm would only cost 36% of the money usually spent on electric bills.
In order to select the best solar harvesting device for the project, a list of products from different companies was created and we contacted them for the necessary details and organized all the information on a spreadsheet. Most of them are still waiting for an update.

Solar Panel Companies and Specs Comparison – Click to open the open source spreadsheet in a new tab
SAMPLE COST SUMMARY
Since quote-request emails still yielded limited responses, an overall average price could not be obtained yet, and the conclusions below were made with a data sample.
Nonetheless, the data result shows that product combinations of two companies stand out as the best options, with one providing the solar panels and another supplying the solar inverters. The PV panel (Series 6) from First Solar gives the longest performance warranty of 30 years and the highest single panel output of 420-450 W.
1,817,640W of First Solar Series 6 cost $0.32 per watt
Total of $581,645.
1.81MW cost $0.16 per watt
Total of $289,600.
For the inverters, company SIC 1 (name not shared due to a signed NDA) stands out for their professional and accurate values for the foreseen energy generation, costing $266,000 in total. Compared to the other obtained quotes, the price was very competitive. They also have free installation and monitoring online courses for their products. This system also enables future solar farm extension for organizations to expand and grow.
As a result, the total estimated quote of solar hardware for One Community’s solar farm project is currently $1,137,245, considering only the PV modulus, racking, and inverters. Prices of remaining hardware are not included in this cost summary. Once the quantity of the electrical hardware in the final design is determined, their total cost can be quickly estimated by any local electrical hardware supplier.
The remaining cost (excluding only PV modules and inverters) would be roughly between $1.02 – 2.31 million, which includes structural and electrical components, installation labor, land acquisition, transmission line, sales tax, overhead and profit, and cost from model updates.
Combining all of the above, the screenshot below is One Community’s Solar Farm Hardware Choice and Cost Summary Table.

Solar Farm Cost Quote and Estimation Table – Click to open the open source spreadsheet in a new tab
Result:
The combination of PV Panels from First Solar and inverter from SIC 1 would be the best option for now.
FUTURE CONSIDERATIONS
- The government offers federal tax credit for profit companies that invest in solar energy, but non-profit One Community does not meet the criteria. However, if we work with another company who can own the solar system and form a contract with them to pay off the system, then One Community satisfies the requirement for the tax credit (26%), and the company and One Community can negotiate for the tax credit benefit.
- Special certification and license are needed in order to install a large system.
- An environmental analysis and inspection with the government is needed prior to the solar farm construction. It includes analysis of solar farm impact on local wildlife and plants specially for endangered species.
Overall, a more experienced team or company is recommended to do the installation of the solar system due to complex government regulation and licensing. In addition, there is potential for them to own the system, and One Community can work out a payoff deal with them.
OPEN SOURCE CONTENT TO BE ADDED LATER
Once on the property, One Community will open source project-launch blueprint the complete process of installing and maintaining our solar-energy infrastructure. We will do this for everything we think will be helpful for those replicating our system(s) as part of the One Community complete open source self-sufficient teacher/demonstration community, village, and/or city model. Upcoming resources will include:
- Layperson’s guide to purchasing all equipment
- Layperson’s guide to working with your county
- Layperson’s guide to installation
- Layperson’s guide to maintenance and upkeep
- Energy production details
- Lessons learned during setup and ongoing use/maintenance
- Use this page (click here) if you have a guide/tutorial you’d like to suggest be added here
RESOURCES
- Schneider Electric – A great resource for learning about microgrid systems
- Article about Agrivoltaics: “Agrivoltaics: Where Solar Energy Meets Agriculture”
- Best Solar Energy Companies Based on In-Depth Reviews
- Article: What is Solar Energy?
- Article: “DIY Solar Garage” – an excellent DIY tutorial and resource of resources
- Inspecting Photovoltaic Systems for Code Compliance PDF
- Article: How to design a solar PV System
- Solar Professional – A one-stop website for everything on solar energy
- Article: Solar power explained: How do solar panels work?
- Instructables: DIY Adjustable Solar Panel Mount
- Hackaday: Building a Wind Power Generator in Your Backyard
- Article: Meet the microgrid, the technology poised to transform electricity
- Article: How Microgrids Could Facilitate a National Grid Overhaul
- Research: “Solar Farms Can Be Good For Bees”
- Research: “New study shows incredible results of pairing solar panels with agriculture”
- Use this page (click here) if you have a resource you’d like to suggest be added here
SUMMARY
At one time, microgrids were only deployed in remote locations or at mission-critical facilities such as military bases or hospitals. Now though, due to several positive economic trends, increasing desire for energy independence and dependability, and a diversity of other reasons, microgrid development is proliferating. Employing distributed energy resources are now a cost-effective solution for many business and government organizations and the trends around technology and energy supply show the costs to build and operate distributed energy resources are rapidly decreasing. All signs point to increasingly advantageous economic conditions for microgrid owners for years to come and One Community will continue to support this through our open source resources sharing our experience installing, expanding, and maintaining our microgrids for the Duplicable City Center, Earthbag Village (Pod 1), the 6 villages to follow, and beyond.
FREQUENTLY ANSWERED QUESTIONS
Q: How are the generators sized?
Generators are sized using the maximum continuous wattage (power) that they can reliably create. If, when every device is turned on and running at maximum, the power draw is 95 kW then we select a 100 kW generator. Most of the time the power draw on the generator will be much less than the maximum load.
Q: How is the system sized?
The energy system will always be designed for the worst-case, maximum load. This would include sizing wires, fuses, and busses to handle every possible device and appliance turned on at once. Even though this is a very unlikely scenario, it ensures that the system will always work within its safe limits.
Q: In what case would the generators activate?
In the beginning we will use the generators for many different activities, but as the project adds sustainable energy sources to the property, the generators will be phased-out in favor of the more sustainable options. However, we will keep the generators on site, in running order and fueled in case of a fault in any part of the energy management system that then requires their use as a backup power source.
Q: What happens in the case of a massive battery fault?
In this scenario the battery banks are damaged or in some way inhibited from providing the stored power back to the system. When the battery failure occurs the system sends a “Start” command to the backup generators causing them to engage, reach working RPM, and sync into the energy grid. During this time the total load of the project less the total amount created by sustainable means at that instant is placed on the generators. They will run until battery storage is back online or the sustainable systems create adequate power to cover the current load.
Q: What happens when there is not enough power to charge the batteries? (Cloudy Week Scenario)
Sometimes there will be a deficit of energy created in the day (solar, wind, etc.) and the remaining energy needed will have to be “made up.” The energy manager hardware will run one or more generators at the most fuel efficient load for as long as it takes to charge the system. Once charged, the energy manager will automatically shut down the generators. In times of low light due to atmospheric disturbances, this could become a daily occurrence to meet the forecasted demands on the system.
An example would be the energy manager calculating the amount of energy in storage and if the stored power does not meet the energy needs of the system for the next 24 hours the generators would run after the solar cycle (evening) to “top off” the batteries for the following day.
Q: What happens in the case of an energy manager hardware malfunction?
In the case that the energy manager fails to operate or detects a fault, the system would go under total generator control. Because improper battery management can cause catastrophic damage. It is safer to allow the generators to take on the entire load of the system and remain in that state until the energy manager fault is discovered and fixed.
Q: How does the system change in an emergency scenario?
As a fault is detected in the system the energy manager hardware, programmed in advance, will compensate by utilizing the different power storage and production equipment options that are connected to the system.
Normal management would be the phasing in and out of sustainable power sources as they come online. However, in the event that a subsystem fails in such a way that could damage the entire system (like a short circuit or an unexpected voltage spike) the energy manager will automatically remove the offending device from the system and rely on other sources. Mechanical systems (fuses, breakers) will also be in place in the case of a very sudden change in voltages (such as a lightning strike or short) that could be too quick for the manager to compensate.
Q: What are the fail-safe measures?
Whenever possible all parts of the system will be designed to fail in a way that provides the safest possible scenario for the rest of the system. Whenever possible the system will also continue to provide power. This said, there could still be times where a catastrophic failure fail-safe would be to cut power completely. The details of this system of fail-safes would depend on the environment in which the system is placed and it’s particular construction and components, so at this time there are no definitive plans.
Q: What systems would be active in a power emergency?
In a power emergency only essential systems should be left on. The following factors would determine which systems are essential:
- The severity of the power emergency: The more severe the emergency, the more systems that would need to be turned off.
- The season: Heaters, for example, would be non-priority in the middle of summer and crucial in the winter.
- Consideration of how often a specific unit is drawing power: If the system is off most of the time it might not hurt to leave that unit in an off state.
- The power draw: If the the hot tub circuit draws 200 times the power that the lights in the Duplicable City Center does, it would be useful to turn that device off, before the lights go out.
- Importance of systems: As in the hot tub example in #4, systems that closely relate to human basic needs (food, shelter, water, etc.) should be prioritized. To make power conservation easy in an emergency, priority circuits should be marked both physically and in the energy controller.
To help put the energy needs of different systems in different situations into perspective, here is a chart showing how much specific components of One Community will contribute to peak wattage needs:

Emergency Power PEAK Wattage Needs Assessment
Now compare this to this chart that shows how much specific components of One Community will contribute to total energy needs:

Emergency Power TOTAL Wattage Needs Assessment
The point of these two charts is to show that components like the heat pump, dryer, and water heaters draw the most power from the perspective of total daily needs because they will be running consistently. Individual heaters, the boiler/water heaters, dryer, and parabolic heaters are the top contributors to peak wattage (energy spikes) because they draw a lot of power at one time. The general trend is still that those items high on one chart are also high on the other chart, but the details will vary and this can be extremely helpful to understand and consider in emergency power situations. Also, to conserve power, the hot tub (a huge energy consumer) has been designated as an item to be used only when surplus energy is available (like in the summer months).
Q: How much bio-diesel will you need?
The per-day fuel use for the landing party is estimated to be about 69 gallons, as explained in the above sections. Generator 1, to enable mobility, must be attached with a double-axle trailer which can be towed as a mobile generator unit to miscellaneous work sites. Generator 2 acts as a stationary backup supply and the battery pack acts as the stationary active supply. Extra fuel would be stored in a fuel bladder with a 2000 gallon capacity, enough for up to 28 days, after which it would need to be refilled from the closest gas station.
Q: What are the benefits of bladder storage for fuel?
Storing fuel in a large bladder is by far the most economical way to store the biodiesel used by the generators. However, bladders are flimsy and easily punctured. They cannot be buried either, so they would have to sit on the ground somewhere protected from heat-sources, and sharp objects.
Q: What are the benefits of tank storage for fuel?
While Tanks are more expensive than bladders, they can be buried to keep them away from heat sources and punctures. Larger tanks would take a large piece of land-moving equipment to place underground.
Q: How long will the batteries take to drain?
Very simply, batteries are rated with their voltage (average) and Amp-Hours. A 50 A-hr 12-volt car battery will provide 1 amp at 12 volts for 50 hours, or 50 amps for 1 hour, or 25 amps for 2 hours, etc. This is the principle used to size the batteries needed on the property. Knowing that we need to provide a certain amount of power (lets say 5 kW) over a certain amount of time (2.5 days = 60 hours) we can start to calculate the batteries needed.
Typical high-voltage batteries can be around 48 volts. Knowing that Volts X Amps = Watts, we can determine the number of amp hours needed:
- 48 volts X (?) amps = 5000 W (5 kW)
- (?) amps = 5000 W / 48 volts = 105 amps (rounded)
Since we need that over the course of 60 hours:
- 105 amps * 60 hours = 6300 amp-hours
If the largest size of battery we can find is 1000 A-H, then we would have to buy 7 of them to cover this draw for 2.5 days.
- 6300 A-H / 1000 A-H = 6.3 â 7
As with all engineering calculations, the largest (predicted) average power drain will be taken into account to build in a buffer to our system.
![]()